Local development instructions
Clone the project from GitHub
Open a terminal or command prompt.
Navigate to the desired directory: Use
cdto navigate to the directory where you want to clone the project.Clone the repository: Run the command
git clone https://github.com/NFDI4Chem/nmrkit.gitto clone the project.Use
cdto navigate into the cloned project directory.
You have successfully cloned the project from GitHub onto your local machine.
Once cloned you can either choose to run the project via Docker-compose (recommended) or locally (need to make sure you have all the dependencies resolved).
Docker
Install Docker: Install Docker on your machine by following the instructions for your specific operating system.
Use
cdto navigate into the cloned project directory and create a .env file which can be copied from .env.template and provide your own values for password and username.You can use the docker-compose.yml file in the root directory, which is same as below and update accordingly if required.
version: "3.8"

services:
  web:
    build:
      context: ./
      dockerfile: Dockerfile
    container_name: nmrkit-api
    volumes:
      - ./app:/code/app
    ports:
      - "80:80"
    healthcheck:
      test: ["CMD", "curl", "-f", "http://localhost:80/latest/ping"]
      interval: 1m30s
      timeout: 10s
      retries: 20
      start_period: 60s
    env_file:
      - ./.env
  prometheus:
    image: prom/prometheus
    container_name: nmrkit_prometheus
    ports:
      - 9090:9090
    volumes:
      - ./prometheus_data/prometheus.yml:/etc/prometheus/prometheus.yml
    command:
      - '--config.file=/etc/prometheus/prometheus.yml'
  grafana:
    image: grafana/grafana
    container_name: nmrkit_grafana
    ports:
      - 3000:3000
    volumes:
      - grafana_data:/var/lib/grafana
  redis:
    image: "redis:alpine"
    ports:
        - "${FORWARD_REDIS_PORT:-6379}:6379"
    volumes:
        - "redis:/data"
    networks:
        - default
    healthcheck:
        test: ["CMD", "redis-cli", "ping"]
        retries: 3
        timeout: 5s
  pgsql:
    image: "informaticsmatters/rdkit-cartridge-debian"
    ports:
      - "${FORWARD_DB_PORT:-5432}:5432"
    env_file:
      - ./.env
    volumes:
      - "pgsql:/var/lib/postgresql/data"
    networks:
      - default
    healthcheck:
      test:
        [
            "CMD",
            "pg_isready",
            "-q",
            "-d",
            "${POSTGRES_DB}",
            "-U",
            "${POSTGRES_USER}",
        ]
      retries: 3
      timeout: 5s
  minio:
    image: 'minio/minio:latest'
    ports:
        - '${FORWARD_MINIO_PORT:-9001}:9001'
        - '${FORWARD_MINIO_CONSOLE_PORT:-8900}:8900'
    environment:
        MINIO_ROOT_USER: 'sail'
        MINIO_ROOT_PASSWORD: 'password'
    volumes:
        - 'minio:/data/minio'
    networks:
        - default
    command: minio server /data/minio --console-address ":8900"
    healthcheck:
        test: ["CMD", "curl", "-f", "http://localhost:9001/minio/health/live"]
        retries: 3
        timeout: 5s
volumes:
  prometheus_data:
    driver: local
    driver_opts:
      o: bind
      type: none
      device: ./prometheus_data
  grafana_data:
    driver: local
    driver_opts:
      o: bind
      type: none
      device: ./grafana_data
  redis:
    driver: local
  minio:
    driver: local
  pgsql:
    driver: local
networks:
  default:
    name: nmrkit_vpc
Run Docker Compose: Execute the command
docker compose up -dto start the containers.Wait for the containers to start: Docker Compose will start the containers and display their logs in the terminal or command prompt.
The API will be available at http://localhost:8080 and the Scalar API reference at http://localhost:8080/latest/docs. Grafana dashboard can be accessed at http://localhost:3000.
Services started by Docker Compose
| Service | Container | Purpose |
|---|---|---|
web | nmrkit-api | FastAPI application |
nmr-load-save | nmr-converter | nmr-cli for spectra parsing and prediction |
nmr-respredict | nmr-respredict | Residual NMR prediction (future integration) |
pgsql | — | PostgreSQL with RDKit cartridge |
redis | — | Cache |
minio | — | Object storage |
prometheus / grafana | — | Metrics and dashboards |
Copy env.template to .env and adjust database credentials before starting.
See the Deployment Overview and nmr-cli service documentation for details.
Standalone
Install Python: Install Python on your machine by following the instructions for your specific operating system.
Open a terminal or command prompt.
Navigate to the directory where your CPM project codebase is located: Use
cdto navigate to the project directory.Create a virtual environment (optional but recommended): Run the command
python -m venv envto create a new virtual environment named "env" for your app.Activate the virtual environment (if created): Depending on your operating system, run the appropriate command to activate the virtual environment. For example, on Windows, run
.\env\Scripts\activate, and on macOS/Linux, runsource env/bin/activate.Install FastAPI and required dependencies: Run the command
pip install -r requirements.txtto install FastAPI and the necessary dependencies.Run the FastAPI app: Execute the command
uvicorn main:app --reloadto start the CPM app.Wait for the app to start: Uvicorn will start the app and display the server address (usually
http://localhost:8000) in the terminal or command prompt.Access the FastAPI app: Open a web browser and navigate to the server address displayed in the terminal or command prompt. You should see your FastAPI app running.
That's it!
Workers
Uvicorn also has the option to start and run several worker processes.
Nevertheless, as of now, Uvicorn's capabilities for handling worker processes are more limited than Gunicorn's. So, if you want to have a process manager at this level (at the Python level), then it might be better to try Gunicorn as the process manager.
In any case, you would run it like this:
$ uvicorn main:app --host 0.0.0.0 --port 8080 --workers 4Update the Dockerfile in case you are running via docker-compose and rebuild the image for the changes to reflect.
CMD ["uvicorn", "app.main:app", "--host", "0.0.0.0", "--port", "80", "--workers", "4"]Logging (Prometheus and Grafana)
INFO
The following instructions are based on the blog post - https://dev.to/ken_mwaura1/getting-started-monitoring-a-fastapi-app-with-Grafana-and-Prometheus-a-step-by-step-guide-3fbn
To learn more about using Grafana in general, see the official Prometheus and Grafana documentation, or check out our other monitoring tutorials.
Prometheus and Grafana are useful tools to monitor and visualize metrics in FastAPI applications.
Prometheus is a powerful monitoring system that collects and stores time-series data. By instrumenting your FastAPI app with Prometheus, you can collect various metrics such as request count, response time, error rate, and resource utilization. Grafana is a popular data visualization tool that integrates seamlessly with Prometheus. It allows you to create custom dashboards and visualize the collected metrics in a meaningful and interactive way. With Grafana, you can build visual representations of your FastAPI app's performance, monitor trends, and gain insights into your application's behaviour.
CPM docker-compose file comes prepackaged with Prometheus and Grafana services for you. When you run the docker-compose file these services also spin up automatically and will be available for you to monitor your application performance.
When you install CPM for the first time you need to configure your Prometheus source and enable it as the Grafana data source. You can then use the data source to create dashboards.
Grafana Dashboard
Now that we have Prometheus running we can create a Grafana dashboard to visualize the metrics from our FastAPI app. To create a Grafana dashboard we need to do the following:
- Create a new Grafana dashboard.
- Add a new Prometheus data source.
- Add a new graph panel.
- Add a new query to the graph panel.
- Apply the changes to the graph panel.
- Save the dashboard.
- View the dashboard.
- Repeat steps 3-7 for each metric you want to visualize.
- Repeat steps 2-8 for each dashboard you want to create.
- Repeat steps 1-9 for each app you want to monitor.
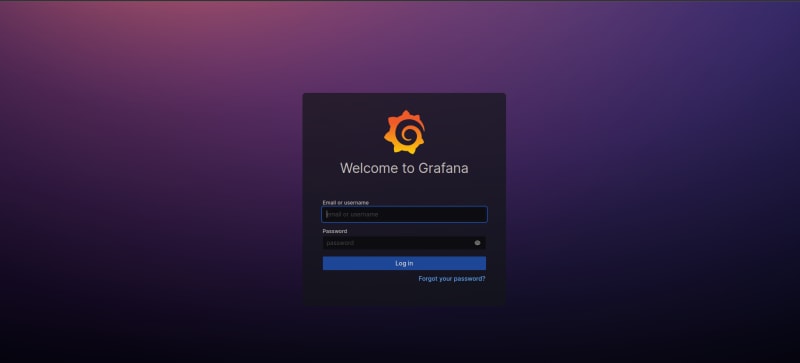
Once you have Grafana running go to: localhost:3000. You should see the following screen:
Grafana login
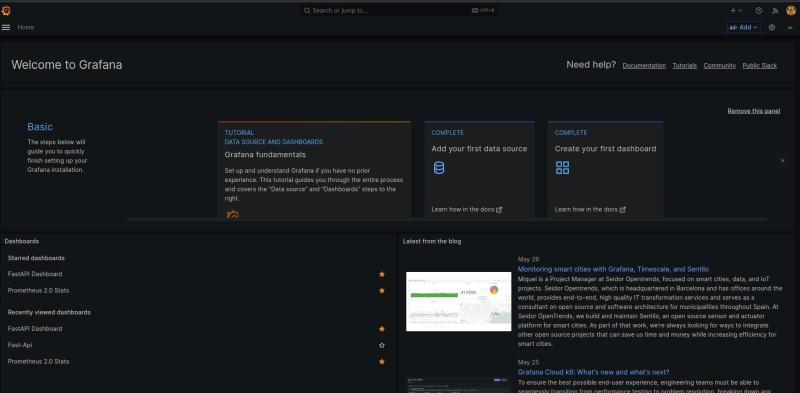
Enter the default username and password (admin/admin) and click "Log In". You should be prompted to change the password. Enter a new password and click "Save". You should see the following screen:
Grafana home
Click on the "Create your first data source" button. You should see the following screen:
Grafana add the data source
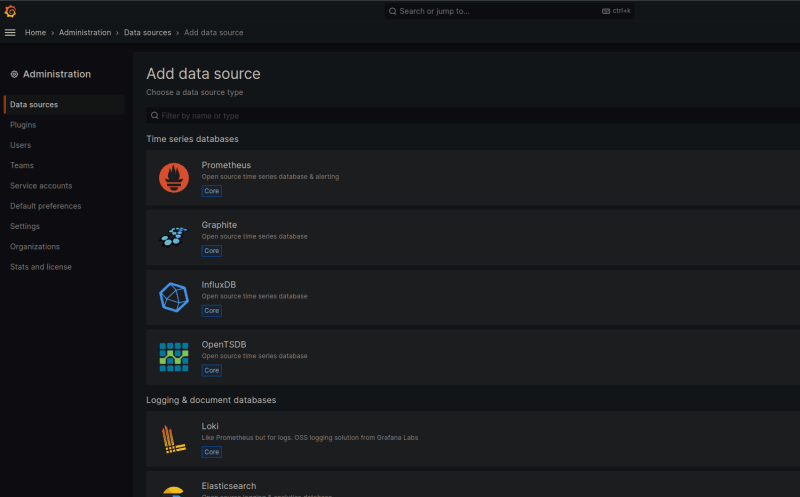
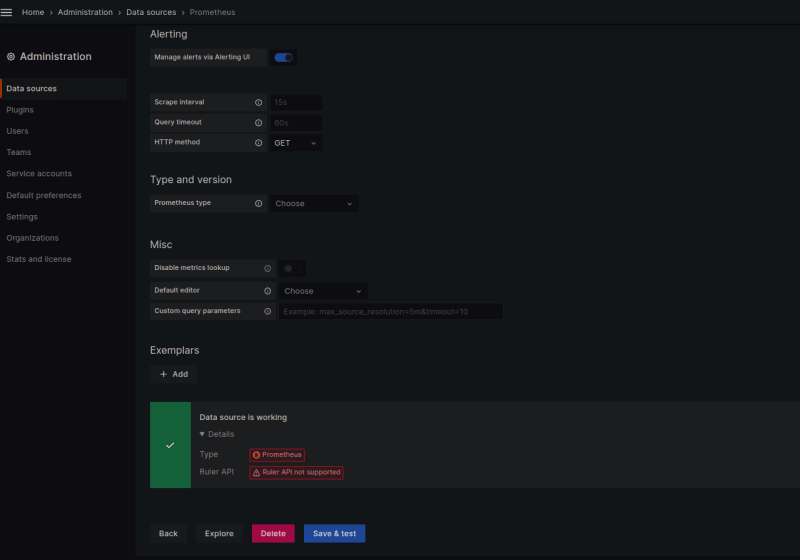
Click on the "Prometheus" button. You should see the following screen:
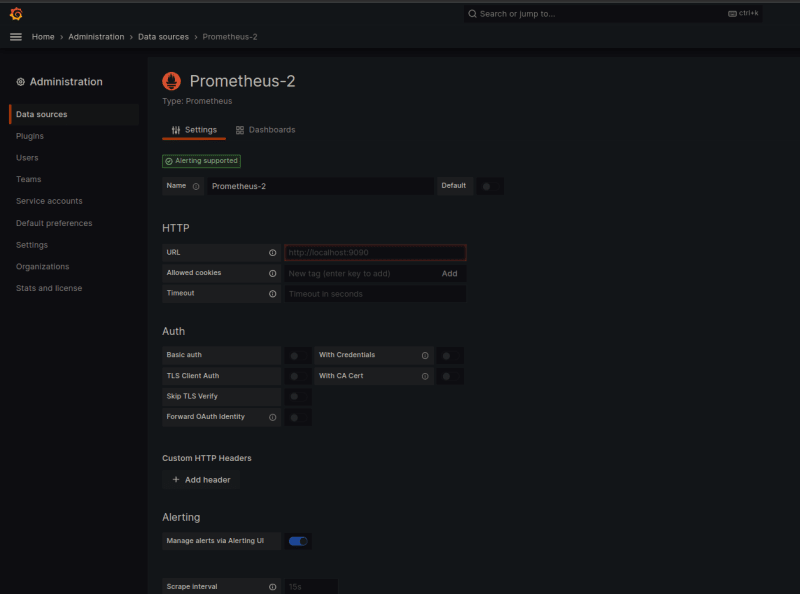
Enter the following information:
Name: Prometheus
URL: http://Prometheus:9090
Access: Server (Default)
Scrape interval: 15s
HTTP Method: GET
HTTP Auth: None
Basic Auth: None
With Credentials: No
TLS Client Auth: None
TLS CA Certificate: None
Click on the "Save & Test" button. You should see the following screen:
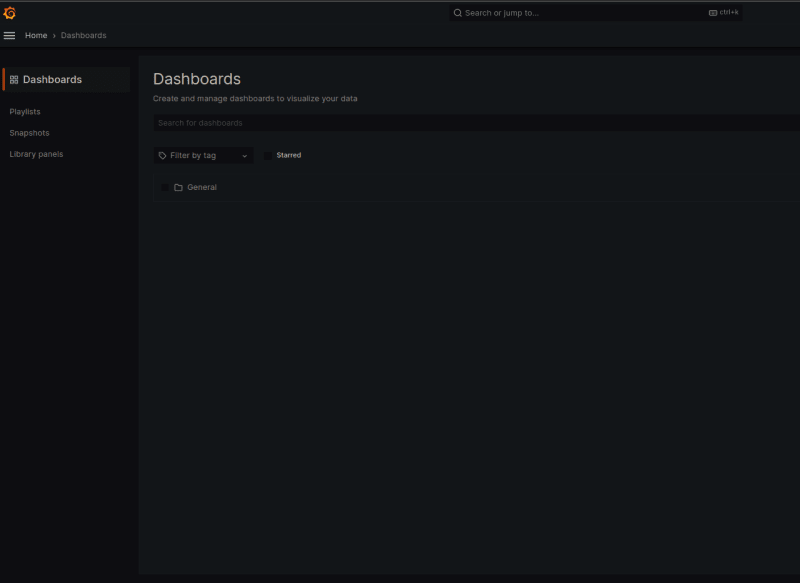
Click on the "Dashboards" button. You should see the following screen:
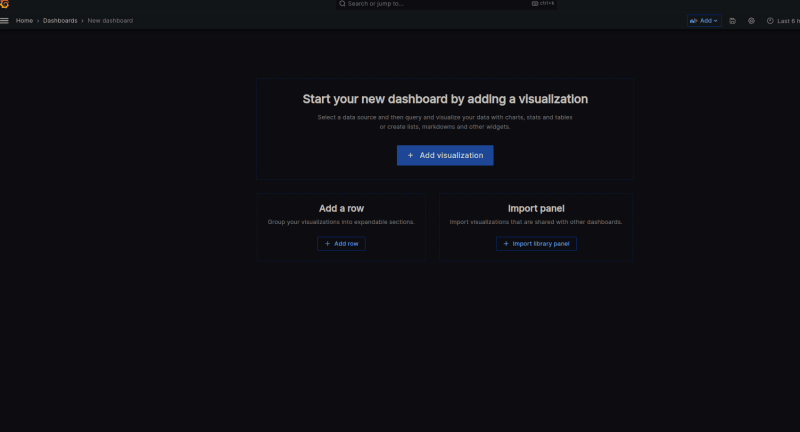
Click on the ""New Dashboard" button. You should see the following screen:
Download the NMRKit dashboard template (JSON) here - https://github.com/NFDI4Chem/nmrkit/blob/main/api-dashboard.json
Benchmarking / Stress testing
Vegeta is an open-source command-line tool written in Go, primarily used for load testing and benchmarking HTTP services. It allows you to simulate a high volume of requests to a target URL and measure the performance characteristics of the service under various loads.
To perform stress testing using Vegeta, you can follow these steps:
Install Vegeta: Start by installing Vegeta on your machine. You can download the latest release binary from the official GitHub repository (https://github.com/tsenart/vegeta) or use a package manager like Homebrew (macOS/Linux) or Chocolatey (Windows) for installation.
Define a target endpoint: Identify the specific FastAPI endpoint you want to stress test. Make sure you have the URL and any necessary authentication or headers required to access the endpoint.
Prepare a Vegeta target file: Create a text file, e.g.,
target.txt, and define the target URL using the Vegeta target format. For example:plaintextGET http://localhost:8000/my-endpointReplace
http://localhost:8000/my-endpointwith the actual URL of your FastAPI endpoint.Create a Vegeta attack plan: In another text file, e.g.,
attack.txt, specify the rate and duration for the stress test using the Vegeta attack format. For example:plaintextrate: 100 duration: 10sThis example sets the request rate to 100 requests per second for a duration of 10 seconds. Adjust the values according to your requirements.
Run the Vegeta attack: Open a terminal or command prompt, navigate to the directory where the target and attack files are located, and execute the following command:
bashvegeta attack -targets=target.txt -rate=attack.txt | vegeta reportThis command runs the Vegeta attack using the target and attack files, sends requests to the specified FastAPI endpoint, and generates a report with statistics.
Analyze the stress test results: Vegeta will output detailed metrics and performance statistics for the stress test. It includes data on request rate, latency, success rate, and more. Analyze these results to evaluate the performance and stability of your FastAPI application under stress.
By following these steps, you can perform stress testing on your CPM FASTAPI application using Vegeta, generating load and analyzing the performance characteristics of your endpoints. This process helps identify potential bottlenecks and validate the scalability of your application.
Linting / Formatting
We recommend using flake8 and Black to perform linting and formatting in Python
Install flake8 and Black: Start by installing both flake8 and Black. You can install them using pip by running the following command:
bashpip install flake8 blackLinting with flake8: flake8 is a popular Python linter that checks your code for style and potential errors. Run flake8 by executing the following command in your project directory:
bashflake8 --per-file-ignores="__init__.py:F401" --ignore E402,E501,W503 $(git ls-files '*.py') .flake8 will analyze your code and provide feedback on any style violations or issues found.
Formatting with Black: Black is a Python code formatter that enforces a consistent style and automatically formats your code. To format your code with Black, run the following command in your project directory:
bashblack .or
bashblack $(git ls-files '*.py') .The
.specifies the current directory. Black will recursively format all Python files within the directory and apply the necessary formatting changes.Note: Black uses a strict formatting style, so it's a good practice to make sure you have committed your changes to a version control system before running Black.